Monthly Analyser
A powerful tool for financial decision-makers to analyze the latest monthly return trends, risk profiles, and statistical anomalies across global markets, helping you make more informed investment decisions with the best market data.
Comprehensive analysis
Powerful tool for behavioral finance analysis - identify seasonal trends in market returns with interactive visualizations.
This powerful tool empowers financial decision-makers to uncover hidden seasonal patterns, assess risk profiles, and identify statistical anomalies across global stock market indices, enabling more informed and strategic investment decisions.
App Compatibility:
Key Features
Choose from predefined popular tickers or enter a custom ticker symbol. The analyzer supports major global indices:
JSE All share[^J203.JO], S&P 500[^GSPC], ASX200[^AXJO].
Select from preset date ranges (Last 5/10/20 years, All Data) or specify custom start and end dates for your analysis.
Change willingly to suite your ideal horizon.
Click the 'Analyze' button to generate comprehensive monthly return statistics and visualizations.
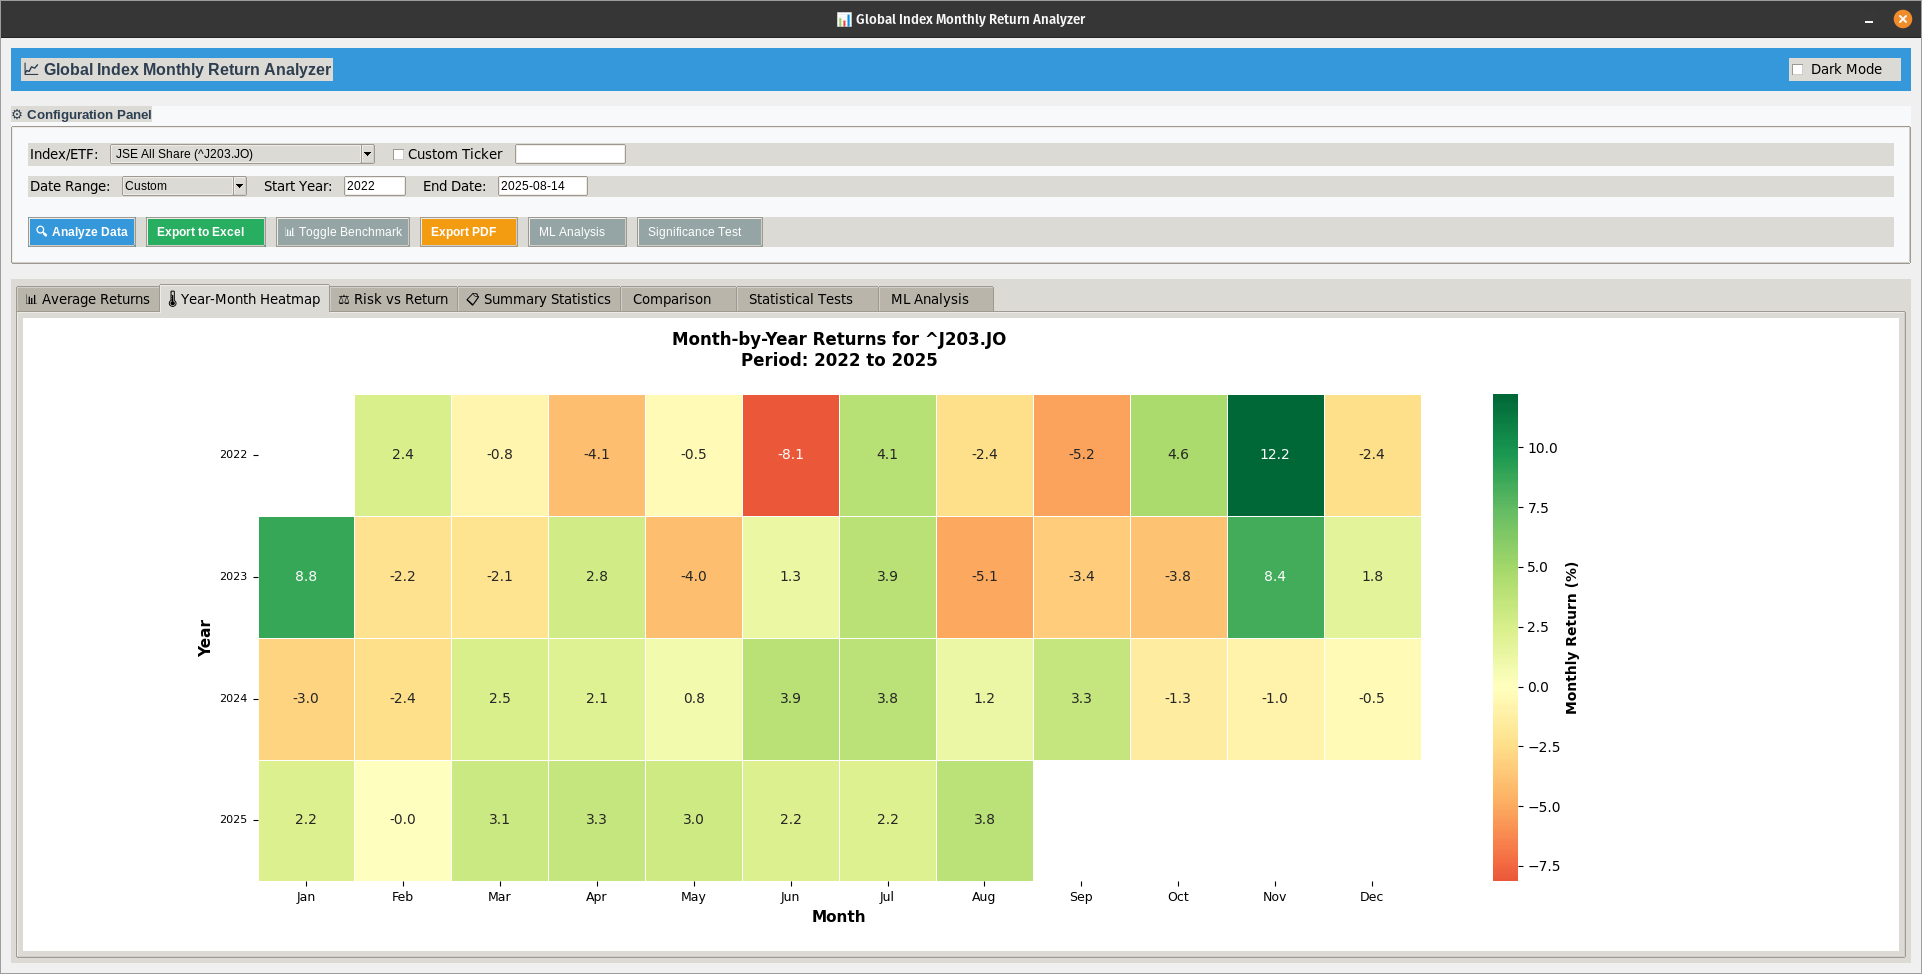
Get data to view data in visualizations - Average returns, Heatmap, Risk vs Return.